
Traffic Page Overview
-
On the top tab click on the Traffic tab to bring up the traffic page. You need to be logged in as an administrator to the Provisioning Tool in order to have access to this tool.
Follow these steps to gain access to the traffic page.
-
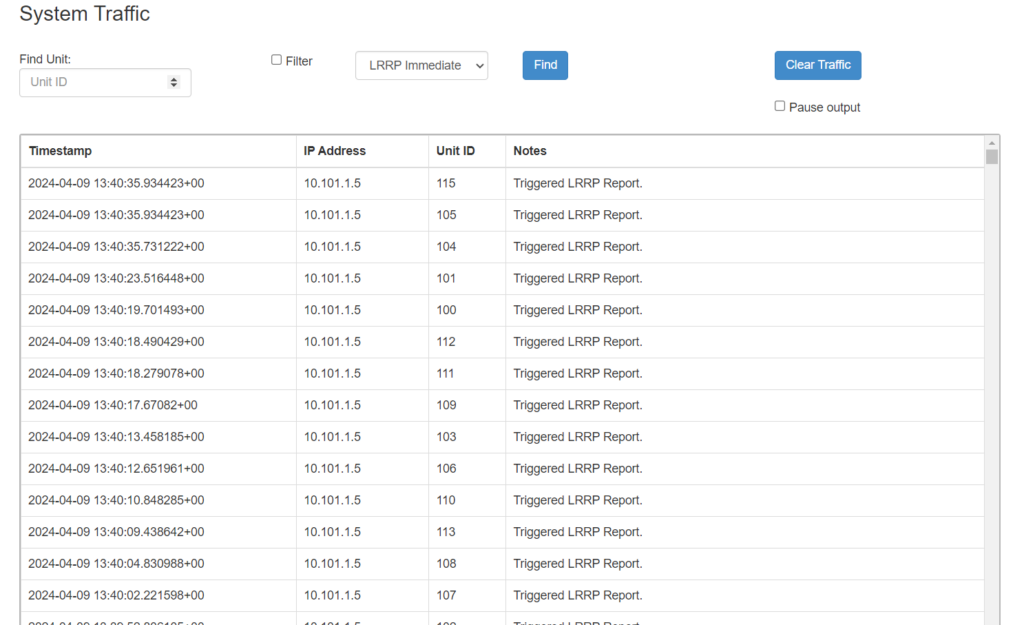
Find Unit – Allows the user to perform an immediate location request to poll the unit.
User must fill in the unit ID and select the type of poll. This will be LRRP Immediate if the unit is using a MOTOTRBO® system, or XL Immediate if using the connexBOX® XL. If you would like to filter the reports based on a specific unit, the Filter check box needs to be ticked as well.
When the unit has been specified and filtered for click the Find button to perform an immediate location request. -
Clear Traffic – When pressed will clear all the traffic in the log.
Pause Output – When enabled paused all traffic window output.
-
Timestamp – The date and time associated with the event given in UTC time.
IP Address – The source IP address for the report. This is dependent on what unit is reporting to the system.
-
Unit ID – The ID of the unit that the report concerns.
Notes – A description of the event.